
Every setup is backed by comprehensive technical analysis, combining:
1. Trendlines and channels to define structure and market momentum
2. Fibonacci retracements, extensions, and clusters to identify precise entry zones and profit targets
3. Support and resistance mapping across multiple timeframes for context
4. Multiple indicators to confirm direction and filter out false signals
5. Pattern recognition (wedges, triangles, double tops/bottoms, head & shoulders) for higher-probability setups
6. Multi-chart confluence between Renko and Range Bars to reinforce signals
7. Risk-to-reward planning with stop placement and profit-taking levels explained clearly
Each trade comes with a detailed explanation of the reasoning — why the setup was chosen, what confirmations were used, and how risk was managed.
With this approach, you don’t just follow signals — you learn advanced analysis techniques, build confidence in execution, and develop the discipline to trade like a professional.
Through the use of Fibonacci retracements, extensions, channels, and harmonic patterns, we pinpoint high-probability support and resistance zones that guide trade setups.
Applied to Renko and Range Bar charts, these tools strip away candlestick noise and highlight structural turning points, trend continuations, and reversal areas with far greater accuracy — creating a stronger foundation for advanced trade execution.
We apply a combination of simple and complex indicators — from moving averages and oscillators to advanced momentum and volume tools — to refine entries with precision.
On Renko and Range Bar charts, these indicators perform more effectively by filtering out candlestick noise, allowing clearer identification of entry triggers, trend confirmation, and momentum shifts. This ensures that signals are not only accurate but also aligned with true market structure.
The highest-probability setups come when indicators align with chart structure. By combining signals from Renko and Range Bar charts with indicator confirmation, we create strong confluence that validates entry points.
Each trade is executed with strict risk management — using well-defined stop placement, favorable risk-to-reward ratios, and clear profit targets — ensuring consistency and protecting capital while maximizing potential returns.
Through the use of Fibonacci retracements, extensions, channels, and harmonic patterns, we pinpoint high-probability support and resistance zones that guide trade setups. Applied to Renko and Range Bar charts, these tools strip away candlestick noise and highlight structural turning points, trend continuations, and reversal areas with far greater accuracy — creating a stronger foundation for advanced trade execution.
We apply a combination of simple and complex indicators — from moving averages and oscillators to advanced momentum and volume tools — to refine entries with precision. On Renko and Range Bar charts, these indicators perform more effectively by filtering out candlestick noise, allowing clearer identification of entry triggers, trend confirmation, and momentum shifts. This ensures that signals are not only accurate but also aligned with true market structure.
The highest-probability setups come when indicators align with chart structure. By combining signals from Renko and Range Bar charts with indicator confirmation, we create strong confluence that validates entry points. Each trade is executed with strict risk management — using well-defined stop placement, favorable risk-to-reward ratios, and clear profit targets — ensuring consistency and protecting capital while maximizing potential returns.
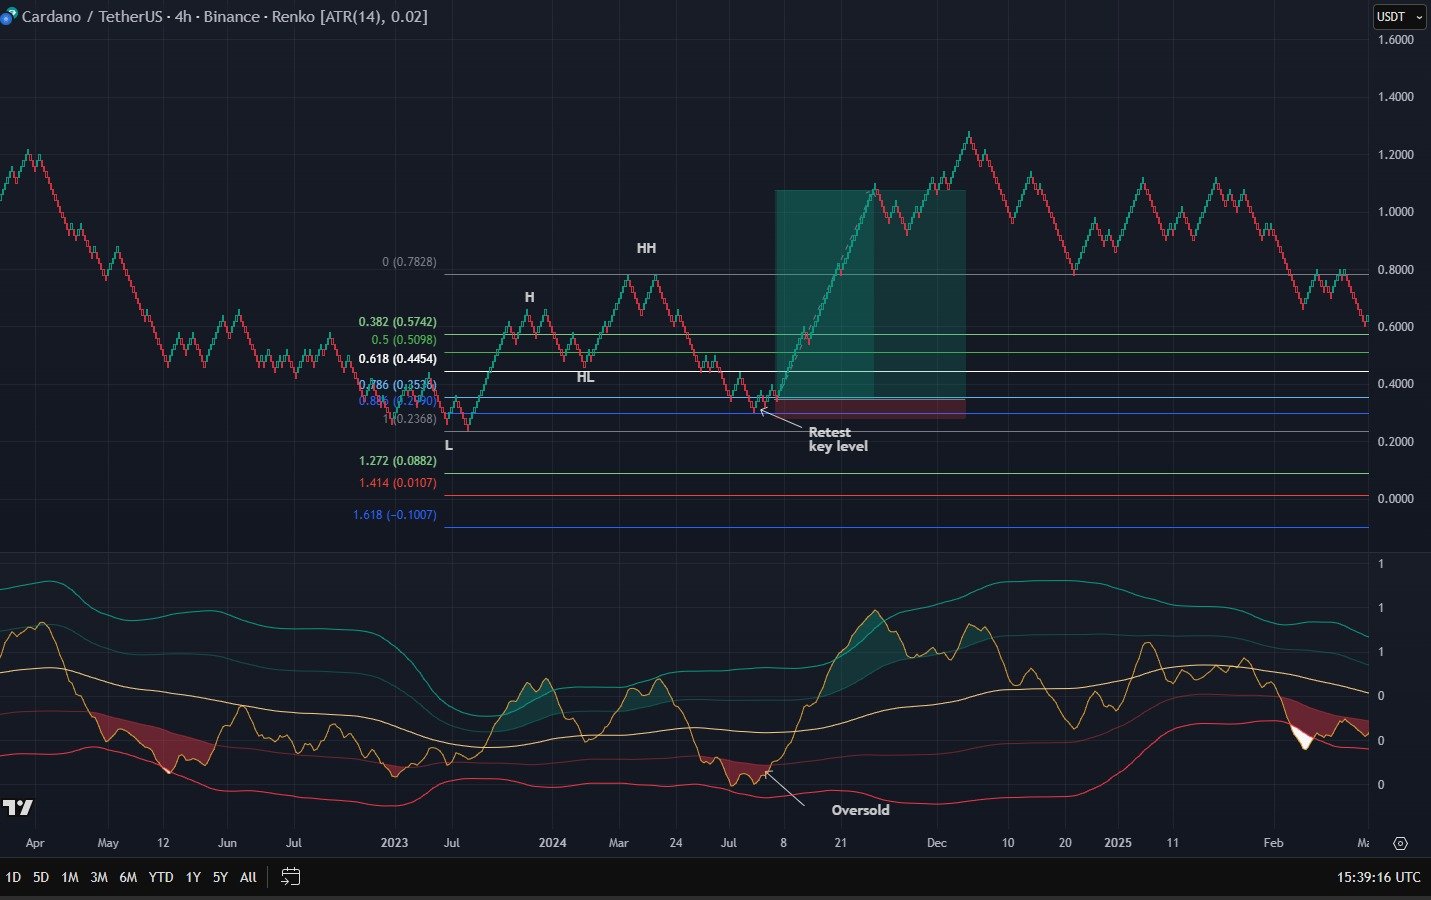
On the 4-hour Renko chart (0.02 ATR), ADA came out of an oversold level, establishing a new swing low. Price action then confirmed strength with a higher high (HH), breaking market structure, followed by a higher low (HL) and another HH — signaling a shift into bullish momentum.
After this move, ADA printed a deep pullback into a key zone aligned with the 0.086 Fibonacci retracement, creating a high-probability setup. At the same time, the bottom indicator signaled oversold conditions, adding strong confluence for a potential reversal.
The entry was executed directly at the Fibonacci level, combining structural confirmation, indicator support, and chart precision.
This setup delivered a massive 1:10 risk-to-reward ratio, demonstrating how Renko charts paired with Fibonacci and momentum indicators can provide exceptionally clean entries with powerful upside potential.
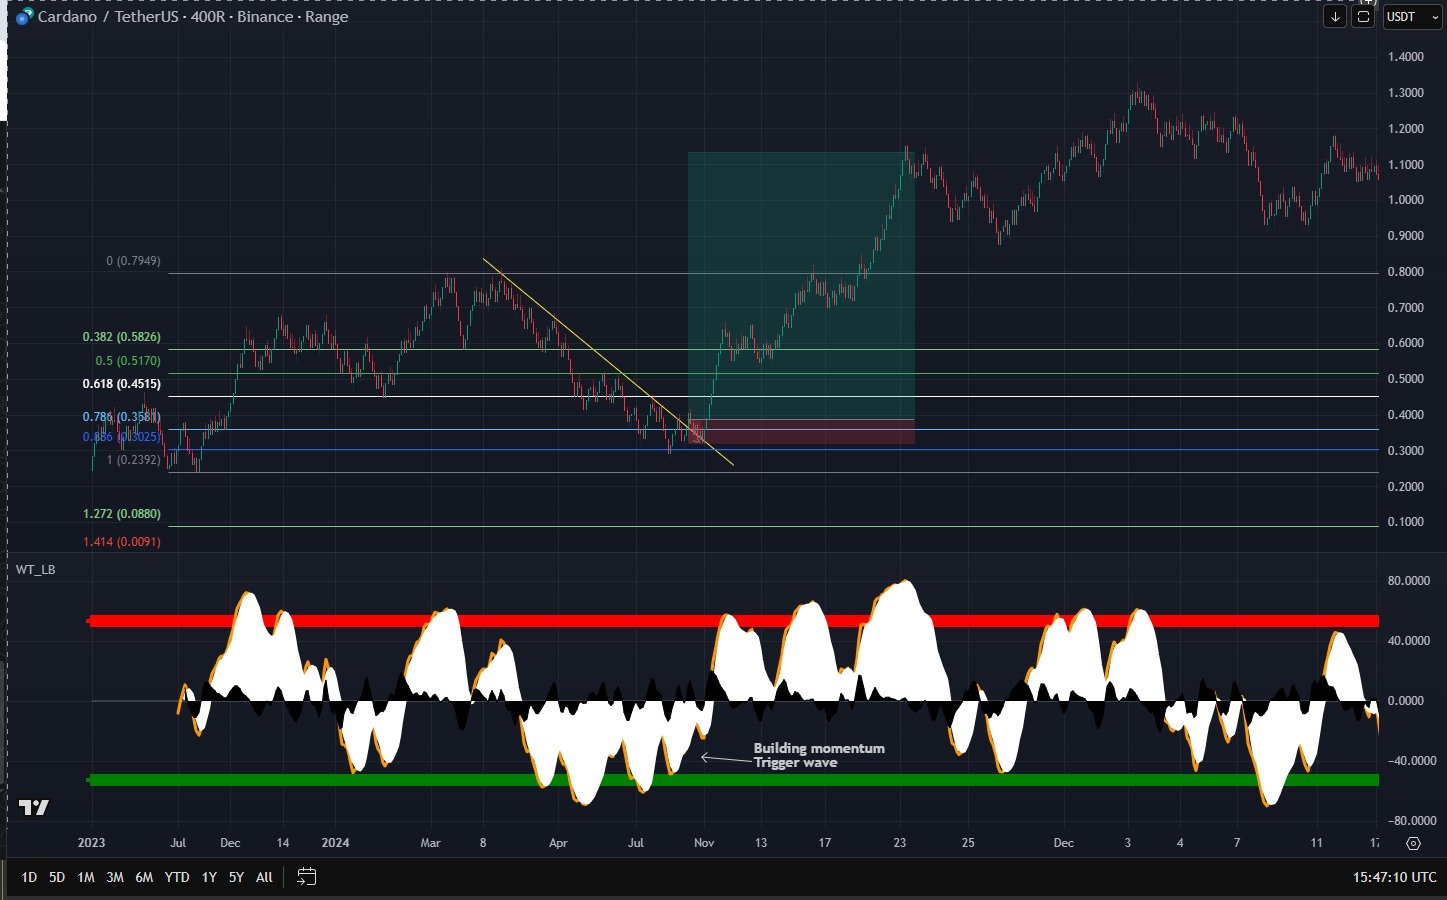
On the 400 Range chart for ADA, price reached a key Fibonacci retracement level, an area of structural importance. At this zone, the WaveTrend momentum indicator displayed a strong bullish divergence, signaling that selling pressure was fading while momentum began to shift upward.
At the same time, the Renko chart confirmed structure with clean rejection bricks, while the Range Bar chart highlighted momentum buildup. This cross-validation between the two alternative charting methods strengthened the probability of a bullish reversal.
Finally, the downtrend trendline was broken, confirming the shift in bias.
The entry was executed on the breakout, aligning Fibonacci support, WaveTrend divergence, and structural confirmation from both Renko and Range Bars — a powerful confluence setup for precision and confidence.
On the 4-hour Renko chart (0.02 ATR), ADA came out of an oversold level, establishing a new swing low. Price action then confirmed strength with a higher high (HH), breaking market structure, followed by a higher low (HL) and another HH — signaling a shift into bullish momentum.
After this move, ADA printed a deep pullback into a key zone aligned with the 0.086 Fibonacci retracement, creating a high-probability setup. At the same time, the bottom indicator signaled oversold conditions, adding strong confluence for a potential reversal.
The entry was executed directly at the Fibonacci level, combining structural confirmation, indicator support, and chart precision.
This setup delivered a massive 1:10 risk-to-reward ratio, demonstrating how Renko charts paired with Fibonacci and momentum indicators can provide exceptionally clean entries with powerful upside potential.
On the 400 Range chart for ADA, price reached a key Fibonacci retracement level, an area of structural importance. At this zone, the WaveTrend momentum indicator displayed a strong bullish divergence, signaling that selling pressure was fading while momentum began to shift upward.
At the same time, the Renko chart confirmed structure with clean rejection bricks, while the Range Bar chart highlighted momentum buildup. This cross-validation between the two alternative charting methods strengthened the probability of a bullish reversal.
Finally, the downtrend trendline was broken, confirming the shift in bias.
The entry was executed on the breakout, aligning Fibonacci support, WaveTrend divergence, and structural confirmation from both Renko and Range Bars — a powerful confluence setup for precision and confidence.
Unlock all Basic signals plus access to high-reward trades generating over 80% profit, even up to 200–300% returns. Each signal includes a full technical analysis, covering our findings and reasons behind every opportunity.
Gain deeper insights into market behavior and profit from premium setups built by our expert team. Ideal for traders seeking maximum returns with clear, detailed analysis on every trade.

Copyright © 2025 AltChartCoin.