
Get access to high-accuracy crypto trading signals built on clear technical analysis. Using Renko and Range Bar charts, we filter out candlestick noise and focus on real market structure. Each signal comes with entry levels, basic structure, and simple explanations so you understand the reasoning, not just the trade.
We combine alternative charts with common indicators to confirm setups, adapt to market conditions, and increase consistency. Whether you’re a beginner or experienced trader, these signals are designed to give you clarity, precision, and confidence in your trades.
Using Renko and Range Bar charts, we cut through the noise of candlesticks and focus on pure price movement. This makes the market structure clearer — trends, reversals, and key levels stand out with precision.
We look for breakouts, retests, and confluence zones across multiple chart sizes. This helps us find high-probability entries where momentum aligns with structure.
With cleaner charts, we can see when the market is likely to continue or reverse. This allows us to stay in trades longer, avoid emotional exits, and maximize profit potential with proper risk management.
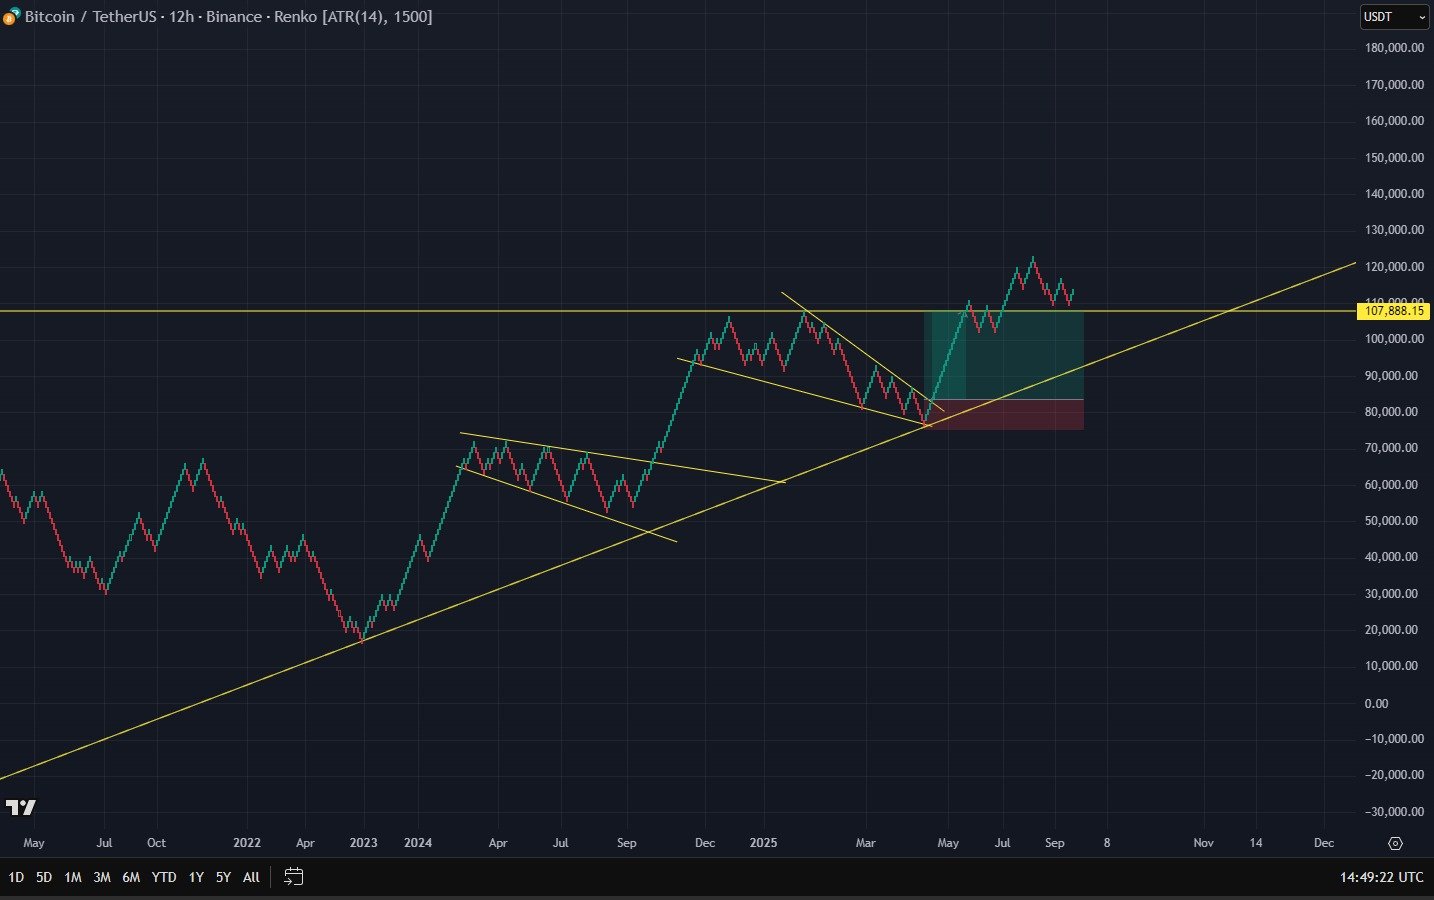
On the 12-hour Renko chart (1500 ATR), we observed a falling wedge pattern developing, which is typically a bullish reversal formation. The wedge showed lower highs and lower lows, but with contracting price action — signaling that selling pressure was weakening while buyers were gradually stepping in.
1. Market Structure
The Renko chart removed candlestick noise, allowing us to clearly see the wedge boundaries and the gradual loss of momentum from sellers. This gave us confidence that a breakout was imminent.
2. Entry Trigger
The trendline break was the key confirmation. Once price closed outside the wedge, bullish momentum was validated. Instead of chasing, we marked the breakout level and prepared for an entry on confirmation.
3. Risk-to-Reward
The trade was executed with a 1:2.5 risk-to-reward ratio. Stop-loss was placed just below the last Renko brick inside the wedge (to minimize risk), while the target was projected based on the height of the wedge and nearby resistance levels.
1. Market Structure
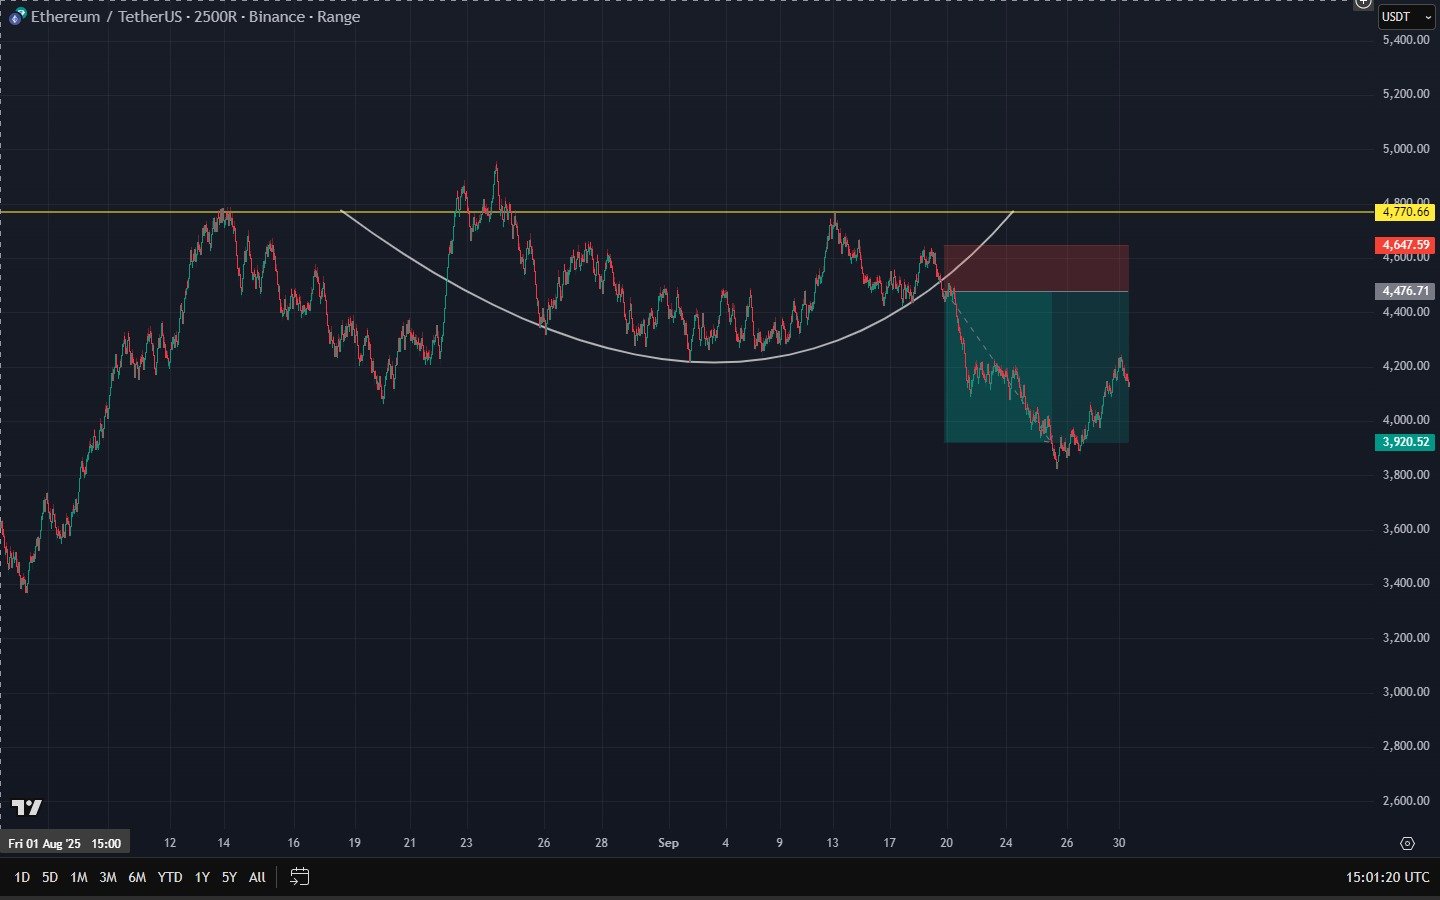
The Range Bar chart filtered out candlestick noise and made the double top clear, with two distinct rejection points at the same resistance level. The rounding pattern between the tops highlighted a loss of buying strength and a buildup of bearish pressure.
2. Breakout & Retest
Once the arc of the rounding pattern broke, the market confirmed a bearish bias. Instead of entering immediately, we waited for the retest (pullback) to the breakout level. This provided a higher-probability entry, as the previous support flipped into resistance.
3. Risk-to-Reward
The short position was executed with a 1:2.5 risk-to-reward ratio. Stop-loss was set just above the retest rejection to limit risk, while targets were aligned with prior support zones and the measured move from the double top pattern.
On the 12-hour Renko chart (1500 ATR), we observed a falling wedge pattern developing, which is typically a bullish reversal formation. The wedge showed lower highs and lower lows, but with contracting price action — signaling that selling pressure was weakening while buyers were gradually stepping in.
1. Market Structure
The Renko chart removed candlestick noise, allowing us to clearly see the wedge boundaries and the gradual loss of momentum from sellers. This gave us confidence that a breakout was imminent.
2. Entry Trigger
The trendline break was the key confirmation. Once price closed outside the wedge, bullish momentum was validated. Instead of chasing, we marked the breakout level and prepared for an entry on confirmation.
3. Risk-to-Reward
The trade was executed with a 1:2.5 risk-to-reward ratio. Stop-loss was placed just below the last Renko brick inside the wedge (to minimize risk), while the target was projected based on the height of the wedge and nearby resistance levels.
1. Market Structure
The Range Bar chart filtered out candlestick noise and made the double top clear, with two distinct rejection points at the same resistance level. The rounding pattern between the tops highlighted a loss of buying strength and a buildup of bearish pressure.
2. Breakout & Retest
Once the arc of the rounding pattern broke, the market confirmed a bearish bias. Instead of entering immediately, we waited for the retest (pullback) to the breakout level. This provided a higher-probability entry, as the previous support flipped into resistance.
3. Risk-to-Reward
The short position was executed with a 1:2.5 risk-to-reward ratio. Stop-loss was set just above the retest rejection to limit risk, while targets were aligned with prior support zones and the measured move from the double top pattern.
Copy trading signals delivered directly on our private Discord channel whenever low-risk opportunities arise. This package focuses on trades with profit potential up to 80%, identified through our unique alternative charting strategy.
Each signal includes a basic market analysis, explaining the reasoning behind every opportunity. Perfect for traders seeking consistent guidance and simplified insights into setups.

Copyright © 2025 AltChartCoin.